

|
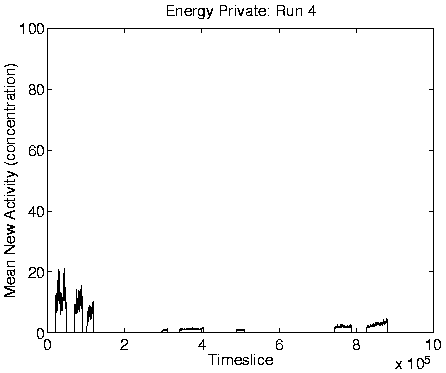
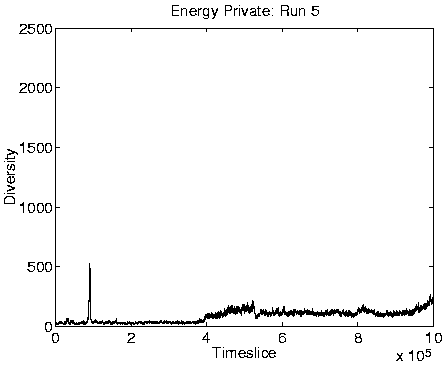
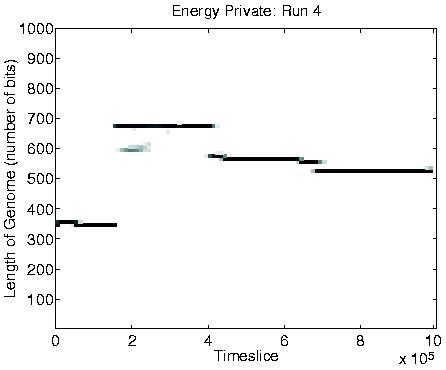
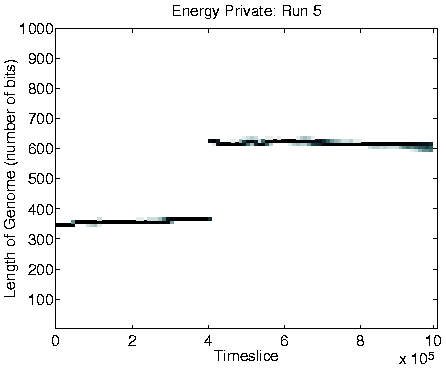
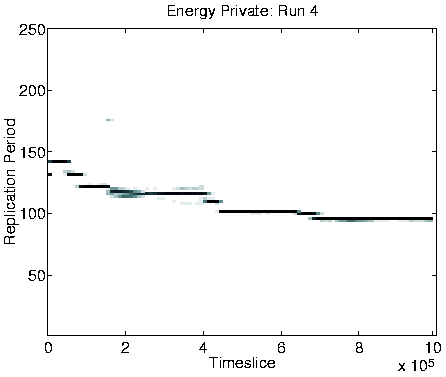
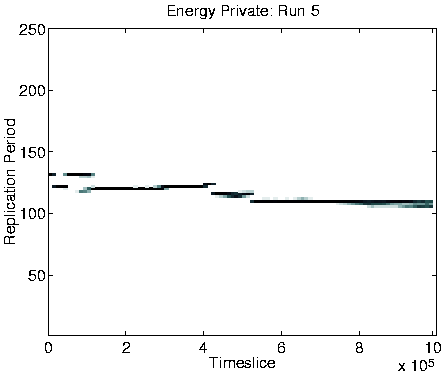
Five of the other runs (numbers 1, 4, 5, 6 and 8) showed behaviour which looked similar to Class 1 dynamics. Graphs of some of the measures of interest are shown for Runs 4 and 5 in Figure 6.17.


|
Looking at these graphs, it is clear that the behaviour of these runs
is not exactly the same as the Class 1 runs we have encountered
before. Mean Cumulative Activity,
![]() (not shown), and
Mean New Activity,
(not shown), and
Mean New Activity,
![]() ,
are both non-zero after the
transition, the population size settles down in the region of
1500-2000 individuals, the diversity is lower than seen in previous
Class 1 systems (but still higher than in Class 2 systems), the
program length initially shows a marked increase, but in some runs
subsequently became somewhat shorter again during the rest of the run,
and the replication period shows a downward trend.
,
are both non-zero after the
transition, the population size settles down in the region of
1500-2000 individuals, the diversity is lower than seen in previous
Class 1 systems (but still higher than in Class 2 systems), the
program length initially shows a marked increase, but in some runs
subsequently became somewhat shorter again during the rest of the run,
and the replication period shows a downward trend.
The fact that
![]() and
and
![]() are non-zero
suggests that particular individual genotypes were spreading
throughout the population even after the transition, as expected
(because their offspring were not being killed off by energy drainage
before they had a chance to reproduce). This is also demonstrated by
the appearance of significant waves in the activity wave diagrams (not
shown) for these runs after the time of the transition.
In other words, effective evolution is still possible, even after the
transition, although it proceeds at a slower pace (the activity waves
are smaller, and
are non-zero
suggests that particular individual genotypes were spreading
throughout the population even after the transition, as expected
(because their offspring were not being killed off by energy drainage
before they had a chance to reproduce). This is also demonstrated by
the appearance of significant waves in the activity wave diagrams (not
shown) for these runs after the time of the transition.
In other words, effective evolution is still possible, even after the
transition, although it proceeds at a slower pace (the activity waves
are smaller, and
![]() and
and
![]() are lower after
the transition). The slower pace is
due to the increased competition for energy (because the longer
programs are collecting more energy from the environment at each time
slice), which generally leads to shorter lifetimes for the
programs. The somewhat smaller population size may also have
contributed to the slower pace (but note that this itself is related
to the greater competition for energy).
are lower after
the transition). The slower pace is
due to the increased competition for energy (because the longer
programs are collecting more energy from the environment at each time
slice), which generally leads to shorter lifetimes for the
programs. The somewhat smaller population size may also have
contributed to the slower pace (but note that this itself is related
to the greater competition for energy).
The fact that well-adapted genotypes can still spread throughout the population also explains why the diversity is lower than was observed in other Class 1 systems.
The decrease in program length in the period after the initial increase which caused the transition is explained by the fact that the system is still able to evolve. Analysis of individual genotypes in Run 4 showed that the shorter programs which emerged towards the end of the run had lost redundant instructions from within their copy loops, and were therefore able to reproduce faster (i.e. the replication period decreased). This process can be seen as a partial recovery of the system from the initial transition to Class 1 dynamics, bringing it back towards Class 2 dynamics.
The final run, number 9, showed results unlike any of the others. The most obvious differences were evident in the graphs of population size and diversity, shown in Figure 6.18.
Investigation of individual genotypes in this run revealed that the population had succumbed to a type a `cancerous' mutation, as encountered in a previous experiment (see Section 6.3.2). As before, the effect of this mutation was that a program's offspring had an extra, redundant instruction tagged onto its end, so that the length of programs in the population grew by one instruction each generation. When we encountered this before, the effect was that the entire population eventually died out, because the programs were being drained of energy by executing all of the redundant instructions. However, in the present case, it happened that the extra instruction that was being added to the end of the programs at each generation was an energy collection instruction (et_collect). As a consequence, rather than dying of energy shortage, the programs were collecting more and more energy as the `cancer' grew. The programs therefore continued to live, although, as each one was so energy-hungry, the environment could only sustain a population size at the level of about one program per grid position (i.e. approximately 1600 individuals). Also, as each offspring was different from its parent (because it had an extra instruction at the end), the diversity of the population was very high, as shown in Figure 6.18. This mutation could therefore be described as a `non-fatal cancer'.